
We asked a simple question: does feeding an AI coding agent a condensed AST report actually save it work and lower token consumption? The honest first answer was.. well no. We did a measurement that proved it, and the rebuild that turned it around.
What is ZigZag?
ZigZag is a small, fast CLI codebase walker that was designed for working with LLM styled programming practices. Generating an AST-chunked Markdown report with a configurable JSON file. By design it was trying to solve a niche problem when talking to chat-based LLMs (e.g ChatGPT, Claude, Grok) where going through 10 different folders, copying/pasting code would not only be time consuming, but inefficient. Chat-based LLMs work better with context and this is where ZigZag was born.
The brutal failure
We were using ZigZag on our internal projects testing it with Claude Code and other LLM driven development tools and everything worked fine, until we checked measurements and benchmarks.. We ran it against its own source tree. 209 files, 1,772 declarations and measured the real token cost of three things an agent actually does: locate declaration, map a module, and map the whole repo. Each was compared against what the native tools (alike of ripgrep) would spend on the same task.
The measurement: grep and slice really does win
First, what "grep-and-slice" means, since it's easy to confuse with plain search. The native way to find something is to run ripgrep over your source and then open the files it points at and reading those files is where the tokens go. Grep-and-slice replaces that second half: you grep ZigZag's condensed report instead of the source, get back an exact file:line–range, and read only that slice. The grep step itself is no faster than ripgrep, but the savings come from never opening the surrounding code.
For smaller jobs, the index paid off. Finding a declaration and reading only its condensed slice, rather than opening the file around it, was consistently cheaper. Mapping a directory or the whole repository is where the native approach means reading many files, and this is where the gap widened dramatically.
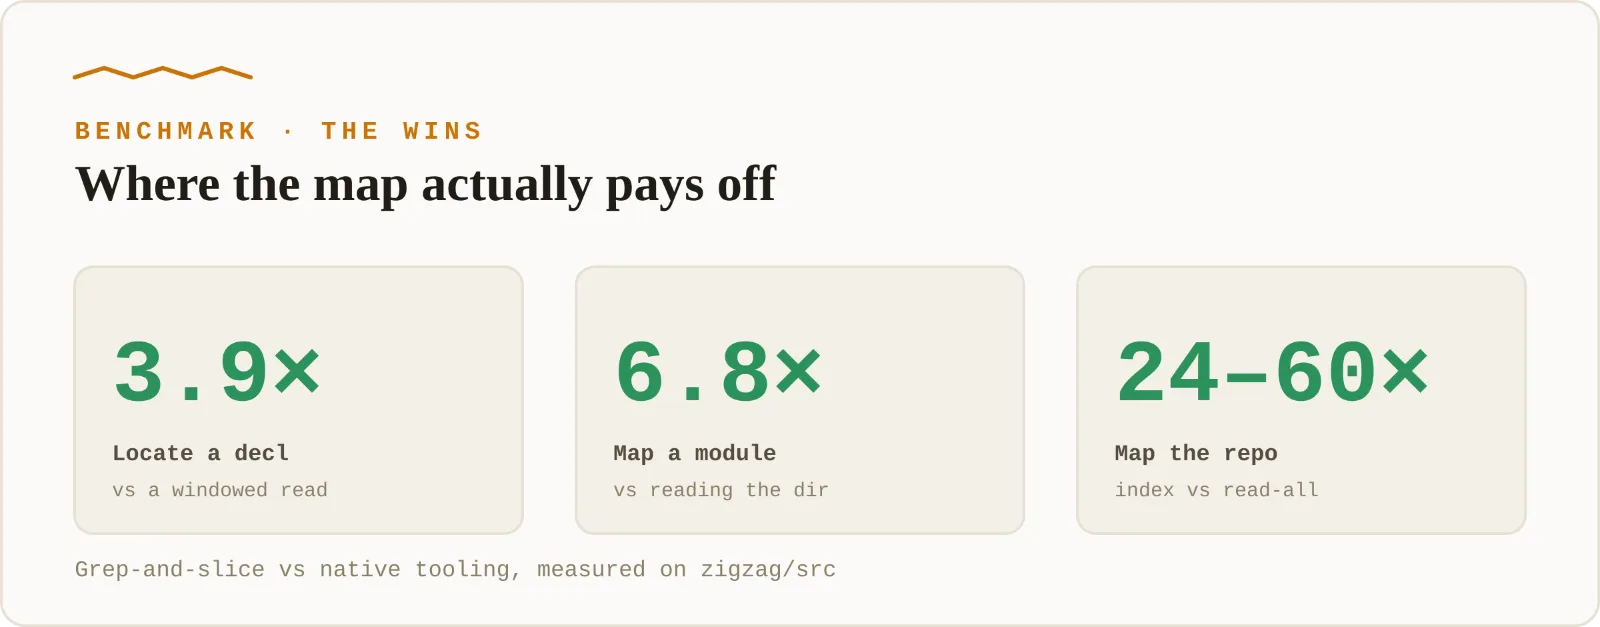
Concretely: locating a declaration ran 3.9x cheaper, mapping a module 6.8x, and mapping the whole repository 24-60x
Across 60 real declarations the pattern was hard to ignore. Finding a declaration through the report took just 174 tokens on average; a windowed read of the source cost 681 for the same answer. And that's the generous comparison against reading the whole file, grep-and-slice was 9.2× more efficient.
Repository scale is where it stops being a rounding error. The complete File Index; a structural map of all 209 files and 1,772 declarations costs only 2,801 tokens to take in the shape of the codebase. A partial Explore sweep of the same repo would spend roughly 67,000 tokens just building that context.
The conclusion was simple: the bottleneck was never the amount of code, it was the cost of discovering where the important code lived. Turning the repository into a navigable map instead of a pile of files changes exploration from a search problem into a lookup problem.
The trap: we tried to load the whole thing
Here is where the story turns. The natural instinct with a "condensed" report is to load the whole thing into context once and query it in place, correct? Or so we thought, we measured that too, and the full report against simply reading every source file it summarizes:
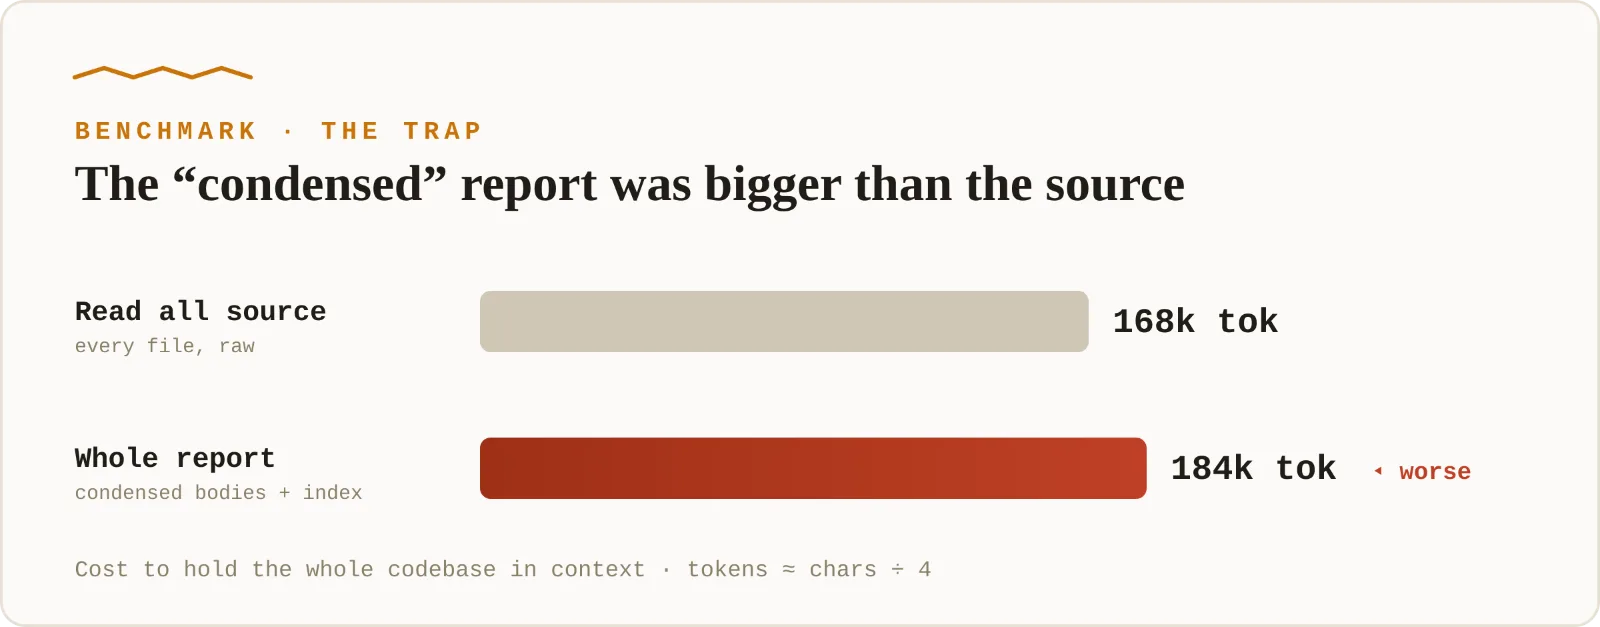
The condensed report revealed an unexpected limitation; it was larger than the source it was meant to compress. The problem was that the report added its own overhead. A structural index, per-declaration headers, and metadata while only marginally reducing the underlying code. Instead of shrinking the information footprint, it layered additional context bloat on top of the content that was already difficult to compress. So the tool built to make a codebase cheaper to hold in context made it increasingly more expensive. The savings came from a different source, grepping the report and pulling a slice, never from ingesting it. The approach became a net loss. For a system positioned as an LLM index, this was a fundamental flaw that needed patching. This is the exact kind of issue that benchmarks reveal while polished demos tend to hide.
A condensed report that costs more than the source is NOT an index, it is simply a second copy with worse ergonomics. An index should reduce cost of understanding and navigating a codebase. If the generated artifact requires more context, more tokens, and more effort to consume than the original source, it failed at its primary purpose.
The fix: keep the shape, but drop the body
The diagnosis pointed us directly to the fix. The report's real value was never the copied source; it was the structure around it. Declarations, signatures, and precise line ranges. The weight came from embedding condensed code bodies, duplicating something that a normal file read already handled effectively. So we separated the two concerns:
The new `llm-signatures` flag keeps the information that makes the codebase searchable: every declaration, its signature, and its exact location. The implementation details are left behind ready to be retrieved only when needed.
Bodies mode - 39 lines:
pub fn init(allocator, io, cache_dir, small_file_threshold) !Self {
    const cwd = std.Io.Dir.cwd();
    cwd.createDir(io, cache_dir, ...) |err| { ... }
    const files_dir = try std.fmt.allocPrint(allocator, ...)
    // ...30 more lines...
    try cache.validateCache()
    return cache
}
Signature mode - 1 line (plus its range)
### src/cache/Cache.zig 20-60
pub fn init(allocator, io, cache_dir, small_file_threshold) !Self
The body isn't gone. The [22-60] is right there. If the agent needs what init does, it reads those 39 lines on demand. The report stops being a copy of the code and becomes a map of it. Across the whole tree, that's a x3 cut:
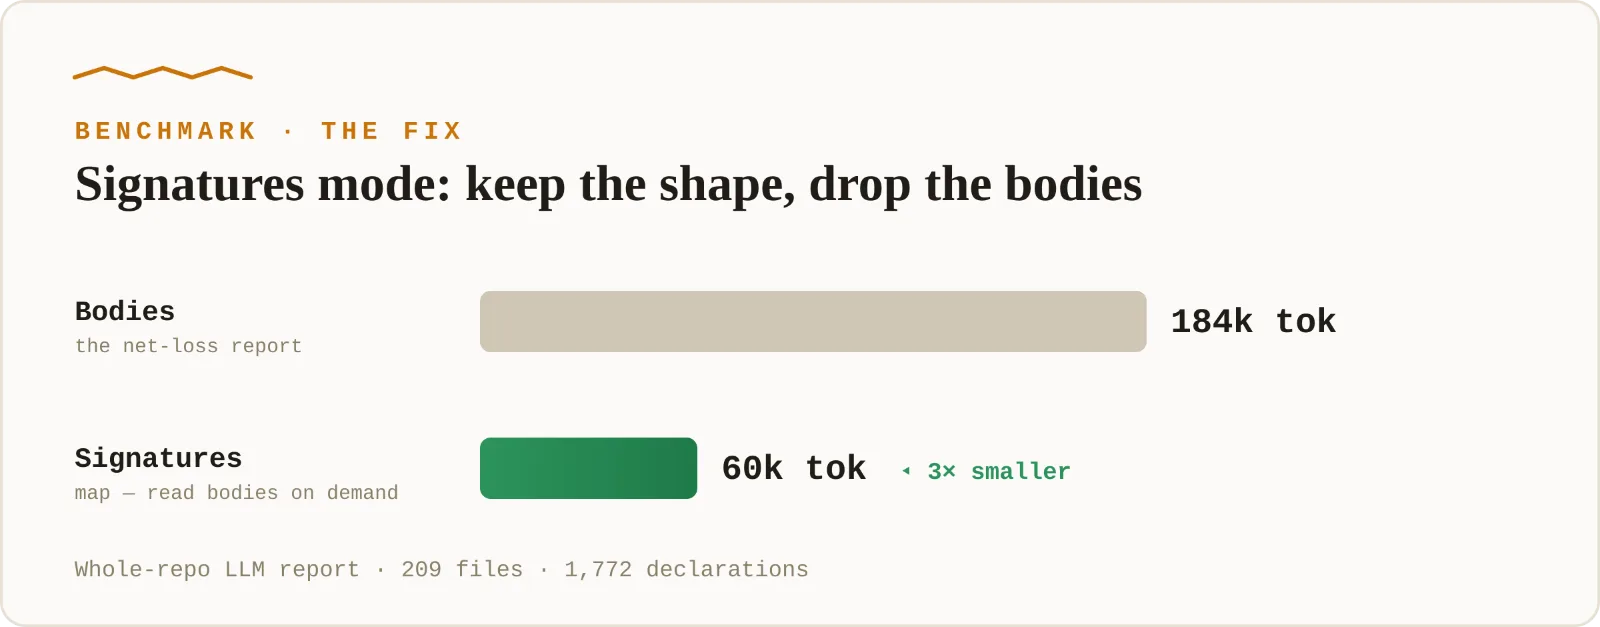
60,000 tokens is small enough to hold the entire interface of the repo in context at once and it finally undercuts the 67,000 lossy Explore sweep would cost. The trap snaps shut in reverse.
Precision: don't guess the cut with a character
First attempt at answering "where does the signature end?" was simple: scan forward until the first ˙{˙ or `;` and it worked until it didn't. A brace inside a default argument, a semicolon inside a string literal, or a comment on the declaration line could all fool the scanner and produce an incorrect boundary. The problem was trying to infer syntax with text matching. Since the report was already built on top of tree-sitter, the solution was to let the parser define the boundary. The signature is now everything between the declaration's start and the byte position its body node begins. No guessing, no heuristics, just the syntax tree telling us where the declaration ends and the implementation begins. The boundary becomes exact and generalized. Of the 17 grammars zigzag supports 16 expose a body field tree-sitter can hand back directly. Kotlin being an exception and it falls back to the old character scan, which is correct for those anyway. One wrinkle surfaced in testing TypeScript's `export function` wraps the real declaration in an export_statement that has no body field of its own, so the extractor descends one level to unwrap it. The result is a clean cut in every language we threw at it:
python: def compute(x,y):typescript: export function greet(name: string): stringgo: func Add(a int, b int) intrust: pub fn scale(v: f64, factor: f64) -> f64Each cut at the tree-sitter boundary are immune to a stray brace or semicolon in the signature. The body, in every case, is one on-demand read away.
The discipline: map first, read after
A map is only useful if you use it like one. Signatures mode answers what exists where: declarations, their inputs and outputs, their location from the map alone. But it does not carry behavior. Ask what a function does and the answer is a follow-up read at the line range, not a guess from the signature.
The failure mode to avoid: Treat signatures as the full source and an agent will confidently invent what the bodies do. Its a navigation layer, not a replacement for reading code. It always opens the referenced range before reasoning about behavior. The savings assume the map is refresh: a line range that points at stale code is worse than reading live source, so the mode earns its keep only with watch mode (via --watch flag or inside JSON configuration file) keeping the report current and up to date.
The verdict: so, does it help now?
Yes, for the right job. For onboarding to a large, unfamiliar codebase with watch mode running, ZigZag now hands an agent a complete, AST-accurate interface map for around 60.000 tokens. A capability the native tools don't cheaply replicate. For quick lookups on a repo you already know, plain ripgrep is still enough, and the map is overhead. The feature didn't make the tool worthwhile; it made it worthwhile for the one thing it's good at.
It shipped as v0.21.0 wired through both CLI flag and JSON configuration, cut at the AST boundary across 16 of 17 grammars, documented map-first, and covered by unit and e2e tests (304 suite, all green). The remaining work is the next set of things a map could do that grep can't: a "used-by" reference index, and content hashes so a stale range invalidates itself.
The larger lesson is older than any of this: a tool that looks useful can quietly cost more than it saves, and the only way to know is to measure the boring, but realistic path, not the demo. The first number we got said "no." and following it honestly is what produced the version that says "yes."
Measured on zigzag/src — 209 files, 1,772 declarations. Token estimate = characters ÷ 4 (ratios are tokenizer-independent). n = 60 declarations (locate), 6 directories (module), full tree (repo). Shipped in v0.21.0; 304 tests passing.